Introduction
Surface finish directly determines whether a precision-machined part will perform as designed. For engineers and machinists working with aerospace, defense, or industrial components, measuring it accurately is essential to meeting drawing specifications and keeping parts functional in service.
Poor surface texture creates real, measurable consequences:
- Reduces fatigue life by up to 40% through stress concentrations
- Increases friction and wear in sliding contacts
- Compromises seal integrity, leading to leaks
- Causes parts to fail compliance inspections on the shop floor
This guide covers the roughness parameters you'll encounter on drawings (Ra, Rz, Rt), the tools used to measure them, how to interpret results against specifications, and the measurement errors that most often corrupt readings. Whether you're verifying a turned shaft, a ground bearing race, or a milled sealing surface, you'll find a practical reference you can apply on the shop floor.
TLDR
- Surface finish encompasses roughness, waviness, and lay—but Ra (average roughness) is the most commonly specified parameter on engineering drawings
- The primary measurement tool is a contact stylus profilometer, though non-contact optical methods and surface comparators are also used depending on the application
- Always measure perpendicular to the lay direction and ensure the surface is clean before taking readings
- Compare Ra values in micro-inches or micrometers against drawing specifications using the 16% rule per ISO 4288 for standard surfaces, or the max rule for critical ones
- Out-of-spec readings require root cause investigation at the machining or finishing stage, not simply re-measuring until numbers pass
What You Need to Measure Surface Finish
Before taking any measurement, identify the required surface finish parameter from your engineering drawing — Ra, Rz, or otherwise. Then select the right tool for your surface geometry and confirm the part is clean and stable.
Tools and Equipment Required
Core measurement tools include:
- Contact stylus profilometer (skidded for shop floor, skidless for lab-grade waviness capture)
- Non-contact optical profilometer (laser or white-light interferometry for delicate surfaces)
- Surface roughness comparator gauges (process-specific reference plates for quick checks)
- Traceable calibration reference specimens (to verify instrument accuracy before measurement sessions)
Each tool targets a different precision level and surface type. Stylus profilometers are the industry standard for machined metal parts. Optical methods handle soft or micro-featured surfaces where contact would cause damage, and comparators give fast go/no-go verification on the shop floor.
Preconditions and Setup
Surface preparation:
- Remove all coolant, oil, chips, or debris that could corrupt the measurement
- Allow the part to reach ambient temperature
- Rest the part on a stable, vibration-free surface
Measurement direction:Measurements must be taken perpendicular to the dominant lay direction (machining marks) to capture the maximum roughness value, per ASME B46.1 and ISO 4287. Measuring parallel to the lay produces misleadingly low readings — the stylus rides along the grooves instead of crossing them.
Key Surface Finish Parameters You Need to Know
Surface finish consists of three components: roughness (small, closely spaced irregularities—the most commonly measured), waviness (broader, periodic variations caused by chatter or deflection), and lay (the dominant pattern direction left by the machining process). When a drawing specifies "surface finish," it refers to roughness — the other two are rarely called out unless the application specifically demands them.
Each parameter is measured and reported differently. Here's what engineers and machinists need to know about the most common ones.
Ra (Arithmetic Mean Roughness)
Ra is the average absolute deviation of the surface profile from the mean line, measured in micro-inches (µin) in the US or micrometers (µm) internationally. Ra averages out peaks and valleys, so a single deep scratch will barely shift the Ra value. This makes Ra useful for general surface quality but less sensitive to isolated defects.
Rz (Mean Roughness Depth)
Rz is the average of the highest peak-to-lowest valley measurements across five equal sampling lengths. Rz is more sensitive to extreme surface events than Ra and will always exceed Ra on any real surface.
Note: A rough approximation is Rz ≈ 7.2 × Ra, but this ratio varies widely (from 4:1 to 20:1) depending on the machining process. It is not suitable for critical design use.
Rt, Rp, and Rv
- Rt (total height): The single largest peak-to-valley measurement over the full evaluation length
- Rp (maximum peak height): The highest single peak from the mean line
- Rv (maximum valley depth): The deepest single valley from the mean line
These parameters matter for sealing surfaces, bearing races, or applications where a single extreme defect can cause failure.
Surface Finish Drawing Symbols
Per ASME Y14.36M and ISO 1302:
- The basic check mark symbol indicates surface texture requirements
- The Ra value is placed in the upper left position
- Additional parameters like Rz or lay direction are indicated with letters and symbols
- Material removal required is shown with a horizontal bar across the symbol base
- Material removal prohibited is shown with a circle in the symbol
- Sampling length and evaluation length entries specify the measurement parameters

Methods to Measure Surface Finish
The right measurement method depends on the surface material, geometry, accessibility, and required precision. Three approaches cover most applications:
- Contact profilometers — standard for machined metal parts
- Non-contact optical instruments — for delicate, soft, or micro-featured surfaces
- Surface comparators — for quick shop-floor go/no-go verification
Method 1: Contact Stylus Profilometer
A diamond-tipped stylus physically traverses the surface and records vertical displacement as a function of distance. The instrument electronically filters the profile to separate Ra, Rz, and other parameters.
Tools/Equipment Needed:
- Skidded profilometer (portable, common for shop floor) or skidless profilometer (laboratory-grade, captures waviness too)
- Calibration reference tile
- Drawing specification for cutoff wavelength (λc) setting
Step-by-Step:
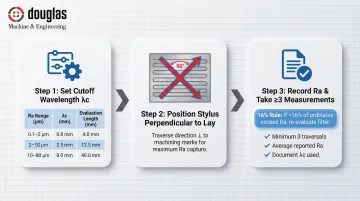
Set the correct cutoff wavelength (λc) and evaluation length based on the expected Ra range. Refer to ISO 4288 or ASME B46.1 for the appropriate λc, and confirm the stylus tip radius suits the surface texture.
Expected Ra Range (µm) Recommended λc (mm) Evaluation Length (mm) 0.02 to 0.1 0.25 1.25 0.1 to 2.0 0.80 4.0 2.0 to 10.0 2.5 12.5 Position the stylus perpendicular to the lay direction and lower it gently at a location representative of the area being inspected. Initiate the traverse. Avoid visible defects like scratches or dents unless those are specifically being evaluated.
Record the displayed Ra and any other required parameters (Rz, Rt). Note the measurement location and take at least three measurements at separate positions per the 16% rule (ISO 4288) to confirm compliance.
Pros and Cons:
- Pros: Industry standard for machined metal; accurate, widely accepted, and relatively affordable
- Cons: Stylus can scratch soft or highly polished surfaces; probe tip radius limits detection of very fine features
Method 2: Non-Contact Optical Profilometer
Uses a focused laser beam or white-light interferometry to scan surface height variations without physical contact, generating a 3D surface map with full amplitude and spacing parameters.
Tools/Equipment Needed:
- Laser profilometer or white-light interferometer (bench-top instrument)
- Vibration isolation table
- Clean lens and surface
Step-by-Step:
Place the part on the measurement stage and ensure the surface is clean. Oils or fingerprints scatter light and introduce errors. Select the appropriate objective lens magnification for the feature size of interest.
Run the scan over the evaluation area as specified in the instrument software. The instrument captures a full 3D height map and applies a Gaussian filter to separate roughness from waviness automatically.
Export Ra, Rz, Sa (areal average roughness — the 3D equivalent of Ra), or other required parameters from the software output and compare against drawing specifications.
Pros and Cons:
- Pros: Ideal for soft, delicate, or highly polished surfaces (optics, medical implants, thin coatings); captures 3D areal parameters a stylus cannot
- Cons: Expensive instruments; sensitive to ambient light and vibration; struggles on steep slopes or very rough surfaces that scatter light
Method 3: Surface Roughness Comparator (Visual/Tactile Method)
A set of reference plates with known Ra values is held against or next to the part surface. The operator compares appearance and tactile feel to estimate whether the surface meets specification.
Tools/Equipment Needed:ASME B46.1 or ISO 1302-compliant surface roughness comparator set matched to the manufacturing process (e.g., milled, turned, ground comparators are separate sets).
Step-by-Step:
Select the comparator set that matches the manufacturing process used to produce the surface (a ground finish comparator cannot be used to assess a turned surface).
Place the appropriate reference plate next to the measured surface under consistent lighting. Compare visually and by dragging a fingernail across both surfaces. The part surface should feel no rougher than the reference plate for the specified Ra limit.
Document the assessment as pass/fail; if there is any doubt, escalate to a profilometer measurement. Comparators are not a substitute for instrument measurement on critical surfaces.
Pros and Cons:
- Pros: Fast, low-cost, requires no power or calibration equipment; well-suited for quick go/no-go checks during production
- Cons: Subjective and operator-dependent; not acceptable for tight tolerances or formal quality records in aerospace and defense applications
How to Interpret Surface Finish Measurement Results
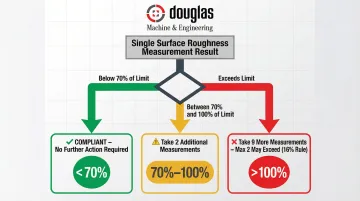
A single measurement at one location won't support a compliance decision on its own. ISO 4288 defines a three-stage decision process based on where your reading falls:
- Below 70% of the limit: Compliant — no further measurements required
- Between 70% and 100%: Take two additional measurements before deciding
- Any reading exceeds the limit: Take nine more measurements; a maximum of two may exceed the limit (the 16% rule)
The "max" suffix on parameters like Rz1max tightens this further — no single reading at any measured position may exceed the limit.
Normal/Acceptable
The measured Ra (or Rz) value is at or below the upper limit on the drawing, confirmed across at least three measurement positions—the surface is cleared for the next stage. If a minimum finish is also specified (two-limit call-out), confirm the surface is not smoother than the lower limit, which can also affect function (e.g., adhesion, lubrication retention).
Minor Deviation
Readings are slightly above spec at one position but below spec at others—take additional measurements per the 16% rule before making a rejection call. Also check that the profilometer cutoff wavelength was set correctly for the Ra range, as an incorrect λc will consistently shift all readings.
Out-of-Spec
Ra or Rz consistently exceeds the drawing limit—investigate the root cause at the machining level. Tool wear, excessive feed rate, incorrect cutting depth, or insufficient finishing operations are the most common contributors.
For aerospace and defense components, out-of-spec surface finish triggers a formal non-conformance requiring documented disposition. Shops operating under ISO 9001:2015 and AS9100D—like DM&E—build surface finish requirements directly into the process plan, which means control points exist before parts ever reach final inspection.
Reading Drawing Symbols in Context
Correctly reading the drawing symbol is the final step in interpreting any measurement result. A value without a subscript defaults to Ra, expressed in micro-inches (ASME) or micrometers (ISO). An "f" location symbol paired with a different parameter name (e.g., Rz 6.3) means that alternate parameter governs at that surface—when both are called out, both limits must be satisfied.
Common Errors and Best Practices When Measuring Surface Finish
Three measurement errors account for most inaccurate surface finish readings. Avoiding them is straightforward once you know what to look for.
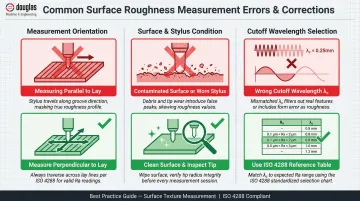
Measuring Parallel to the Lay
Traversing along the machining direction produces the lowest possible roughness reading because the stylus follows the grooves rather than cutting across them. Always orient the stylus traverse perpendicular to the dominant lay pattern to capture the true maximum roughness value.
Contaminated Surface or Dirty Stylus Tip
Even a thin film of coolant, oil, or fine debris between the stylus and the surface will produce erratic, artificially elevated readings. Before each measurement session:
- Wipe the surface clean with an appropriate solvent
- Visually inspect the stylus tip for wear or chipping
- Replace the stylus if the tip is damaged — tip wear directly skews Ra values
Incorrect Cutoff Wavelength (λc) Selection
Using a λc that is too long includes waviness in the roughness reading, inflating Ra. Using one that is too short excludes genuine roughness features, deflating it. Select λc based on the expected Ra range per the ISO 4288 or ASME B46.1 reference tables and verify the instrument setting before recording data.
Regardless of which error type you're guarding against, calibrate the profilometer against a traceable reference tile at the start of each session and document the result. This single habit catches instrument drift before it corrupts your data.
Frequently Asked Questions
How is surface finish measured?
Surface finish is most commonly measured with a contact stylus profilometer, which traverses the surface perpendicular to the lay and calculates parameters like Ra and Rz from the recorded profile. Non-contact optical methods and surface comparators are also used depending on required precision and surface type.
What does a 3.2 surface finish mean?
3.2 refers to an Ra value of 3.2 micrometers (µm), equivalent to approximately 125 micro-inches. It's a moderate finish commonly produced by standard milling or turning and is appropriate for general-purpose machined surfaces without tight sealing or sliding fit requirements.
What are the different types of surface finishes?
Surface finish is composed of three elements—roughness (fine, closely spaced peaks and valleys), waviness (broader periodic undulations), and lay (the directional pattern from the manufacturing process). Different manufacturing processes such as grinding, milling, turning, lapping, and EDM each produce characteristic surface textures with different typical Ra ranges.
What is a number 1 surface finish?
A No. 1 finish is a designation used in the stainless steel sheet and plate industry (not machined components)—it refers to a hot-rolled, annealed, and descaled surface with a dull, non-reflective appearance and relatively rough texture. It is not the same as an Ra value and should not be confused with roughness parameter numbering.
What is the difference between Ra and Rz?
Ra is the arithmetic mean of all surface deviations from the mean line and tends to underrepresent extreme peaks or valleys. Rz averages the five largest peak-to-valley heights across five sampling lengths, making it more sensitive to isolated defects. Rz is almost always larger than Ra — a common estimation is Rz ≈ 7.2 × Ra.
What tools are used to measure surface finish?
The main tools are contact stylus profilometers, non-contact optical profilometers (laser or white-light interferometry), and surface roughness comparator gauges. Selection depends on the required accuracy, surface material, and whether the result is for formal inspection records or a quick shop floor check.